
In a previous blog post I argued that the most important in-bound marketing metric to track is the leads your marketing campaigns generate. The in-bound leads should fill up the entrance to your sales pipeline and ensure that you always have enough qualified leads to satisfy your growth targets.
But. how many lead requests are you getting per month? Has the number of requests increased or decreased recently? Which products get the most requests? Those are quite simple questions but – in my experience – many marketing teams do not necessarily have a systematic approach to track metrics like this.
In this blog post, I will share some ideas for setting up a Requests Metric System to gather data for your incoming requests and track them month by month. As a bonus, you can download the Excel sheet template that I used to create the examples in this post. It is totally free.
What metrics to track?
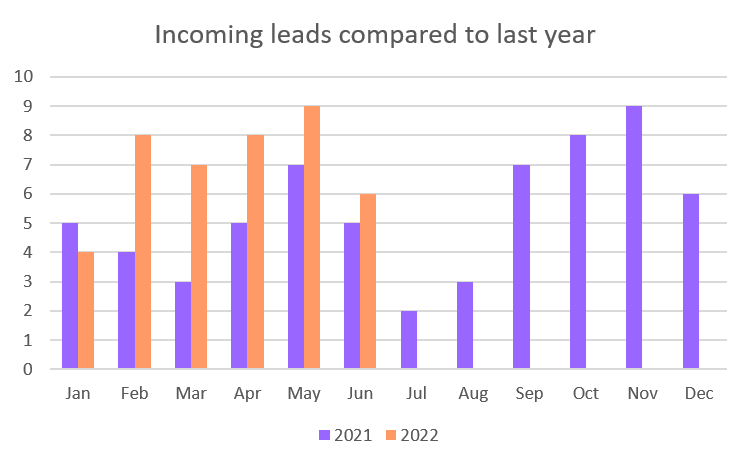
Naturally, you should track how many real leads you get. I suggest to track monthly because the sales cycles in B2B sales generally are long and the number of qualified leads per month in small-to-medium sized companies are generally fairly low. It is common that the number of lead requests vary quite a lot over the year due to holidays (fewer leads), trade shows (more leads) and time limited campaigns you run (hopefully more leads). Therefore, I suggest comparing the number of incoming leads per months with last year as shown below. If the number of leads is increasing compared to last year you are propably good but, if the number is decreasing this is an early warning that your sales pipeline is getting thinner and you have to do something.
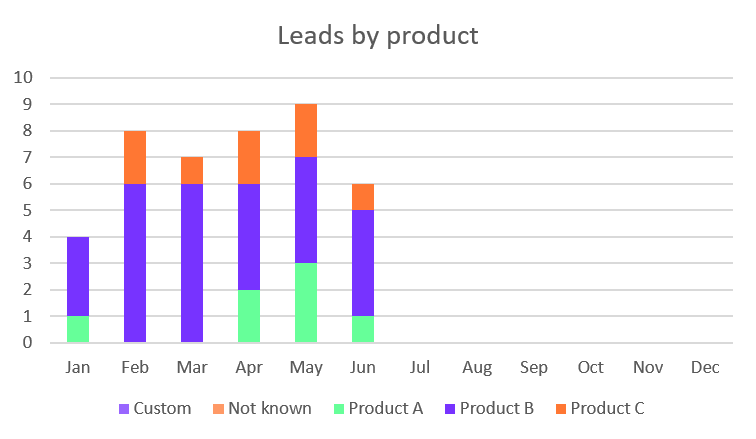
It may be helpful to segment the leads to get a deeper insight into what types of requests you are getting. If you have several products or services you can segment by product type and thereby see if one product or service is more popular than another. In the example below Product B seems to be more popular than the other products. It could be that Product B is simply more appealing but, it could also be that you need to improve your marketing for Products A and C. Other useful segmentations could be by sales rep, by geographic region, by industry and by application.
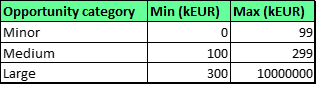
Another important segmentation of your incoming leads is by importance. You likely have different categories of customers depending on how much they buy and/or how strategic they are for your business. If you don’t do this kind of segmentation I strongly recommend it because it will enable you to guide your sparse resources to the customers that generate most of your revenue and spend less time on the customers that never really generate any revenue.
A simple categorization of your prospects could look like shown in the table below. In the example, a large opportunity means a customer that is going to buy for more than 300,000 EUR whereas a minor customer buys for less than 100,000 EUR. The numbers and categories should of course be adjusted to match your specific business.
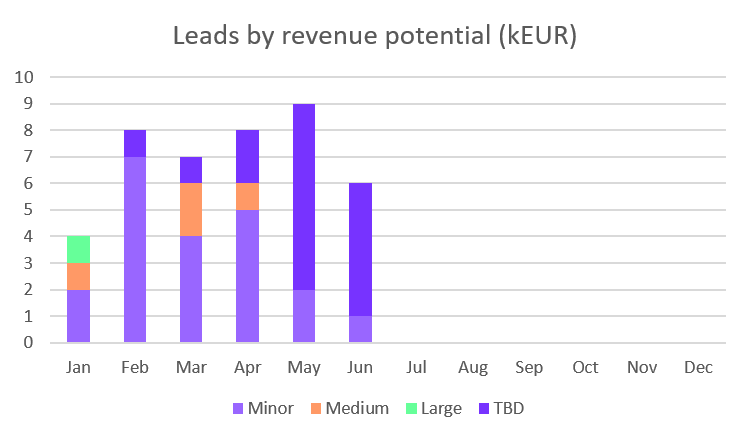
I bet your company has some growth targets which drills down to a certain number of new revenue your company should generate each year. This revenue growth is coming from new and existing customer opportunities which often start as a lead request. You may think that you are doing great because the number of leads is increasing but, if all the leads are “minor” prospects buying for only 5,000 EUR you will maybe not reach your targets. The graph below shows an example of leads per month segmented in revenue potential. Very often you will not know the revenue potential until after the first meeting with the customer and therefore the younger the leads the more of them will be categorized as To Be Determined (TBD). This is totally fine as long as you keep an eye on getting the category information about the prospects.
The process
Now that you know which metrics to track each month we come to the less amusing part: how do you implement a process which is not a huge administrative burden for you and your team? Well, I will claim that with a few routines in place and a good Excel sheet you can boil this down to maybe half a day’s work per month.
Qualifying and storing the leads
First, we need to make sure to only work with the good leads. The lead requests typically come from prospects filling out a form on your website, calling you on the phone or sending an email to your sales contact email. However, not all contact requests qualifiy as leads. You are likely getting a decent number of spam requests from robots. These are generally easy to identify and neglect. You will likely also get requests that are genuine but not relevant. Let us say you sell simple hand tools like screwdrivers and hammers and you get a request for a complete tool truck. Such a request is not relevant for your business because you don’t sell trucks and this should not be counted as a lead.
The bottom line is that it is generally a manual process to read and discard the non-relevant requests.
Most of the incoming requests will result in an email in the inbox of the person(s) handling the incoming leads. For instance, when a prospect fills out and submits a form on your website, an email will be send to someone in your organization. The same goes for emails like sales@company.com. Whenever a new request lands in the inbox it is important to read and qualify the request immediately as described above. The requests that is deemed to be relevant for further processing should be acted upon by for instance handing the information to a sales rep or directly contacting the customer. The remaining requests should simply be deleted.
A simple way, that I have used personally, is to temporarily store the incoming, qualified requests by moving them to a sub-folder in your email-program after you have processed them. Once per months you open this sub-folder and add them to your Requests Metric System as described later.
Request Metric System
There are a lot of sales and pipeline management tools on the market but I haven’t found one that – in a simple yet adaptable way – could help me keep track in-bound leads. Most tools, that I tested, were better suited for pipeline management but, we are working on opportunities pre-pipeline. To be fair, I haven’t done a thorough evaluation of every tool on the market so, I am not saying you can’t find a tool that will do what I am about to describe below.
The “tool” I use is simply an Excel sheet with columns for all the relevant information about each new opportunity This could include the following:
- The date the opportunity requst was received: I actually only use the month and year.
- The way the customers contacted me
- An ID number
- The Company name
- The Sales rep responsible
- The status of the lead
- The main product the customer is interested in
- The customer’s application
- The potential volume (how many units is the customer going to buy)
- The unit price
- The potential revenue
- The status of the customer’s project
- Additional information
The Excel sheet I use looks like the picture below.
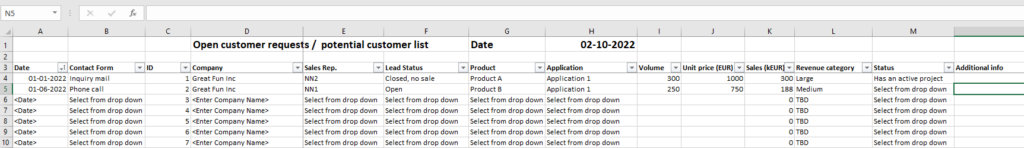
In order for the graphs to work properly the dates must be entered as the first day in the relevant month – i.e. 01-01-2022 for january first 2022 – even if the lead came in on January 23rd.
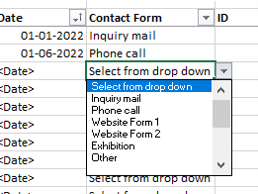
As can be seen many, of the fields can be filled by selecting an option from a drop down list. For instance the Contact Form can be chosen between Inquire mail, Phone call etc. When the data is entered from a drop down list with pre-defined options you avoid spelling errors which might cuase errors in your summations for the KPI graphs.
The Lead Status in column F basically tells whether the lead is
- still open – which means you are still working on the lead
- has been moved to the sales pipeline – which means it was qualified as a real opportunity
- closed – which means the customer’s project got closed or your product or price didn´t match their needs
When you fill in the volume (number of units the customer expects to purchase) and the unit price of the relevant product, the potential sales revenue can be calculated and based on that the category is automatically defined as TBD, minor, medium og major.
The Status in column M is the status of the customer’s project. This can help you track the urgency of the project. For instance, the customer might tell you that he has to find a solution within the next 3 months to a really important problem. In that case the customer has an active need and it is important that your company responds quickly in order not to loose momentum. However, if the customer tells you that she is just performing an early feasibility study to clarify their options, there is no urgency and you sholdn’t expect this sale to close any time soon. The options I typically use are:
- Not known
- Has an active project
- Interested but no active project
- Not interested
- Project closed
The additional info field is always good to have as a placeholder for your personal notes about the customer project.
Working with the system
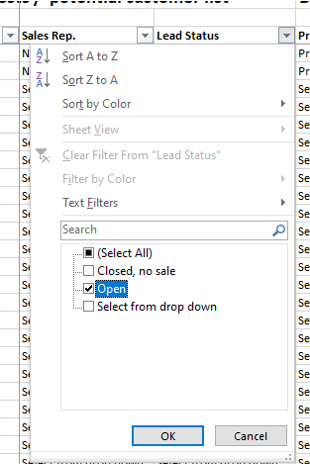
As mentioned earlier, I typically update the Request system once per months. The first thing to do is to enter the data for all the new leads that came in during the last month. You may not have all data for each lead but, just enter as much as you have. Next, go through the older leads with the status “Open” and enter any updates. The Excel template has filters for each column so if you deselect everything but “Open” in the “Lead Status” column, you will only see the active leads.
It is quite common that some customers are non-responsive for a long period of time, even if you have tried several times to get in contact. In this case, I recommend changing their status to “Closed” if nothing has happened in 3 – 6 months. If the project resurfaces and the customer contacts you again, you can always re-open the lead but, there is no point in tracking dormant or even dead projects.
Once you have added new leads and updated the exisiting open leads, the graphs for incoming leads per months, incoming leads by product and incoming leads by category will be automatically updated. You can review the numbers and use them for evaluating your marketing strategy and/or reporting KPIs to management.
I admit, that this part of the process does take some time – likely between 2 – 8 hours. But, it is only once per month you have to do this and the outcome is that you have a nice and deep insight into how your business is doing in terms of in-bound leads. Once you have used the system for some time, you can start to extract really valuable information. For instance, you will get data for the likelyhood that a new lead will end up in the pipeline. Such kind of information can be used to predict if you are getting enough leads to fill your pipeline or you have to step up your marketing to get more leads.
I hope you have found the information in this post informative and helpful. Pleasse, do not hesitate to comment or contact me if you have any questions.